import geopandas
import mapclassify
import pandas as pd

gdf = geopandas.read_file("water_fixed_coordinates.geojson")Using Python
We use the package GeoPandas to load in spatial data. Here is a tutorial of GeoPandas to get started.
You can run all of this in a Google Colab notebook here.
Getting started with spatial data
The gdf variable is a GeoDataFrame data structure, which works just like a Pandas DataFrame data structure, except it has a geometry column that contains the spatial data corresponding to each county.
Let’s plot the column “percent_lacking_plumbing”, overlaid with the spatial information:
gdf.plot("percent_lacking_plumbing", legend=True)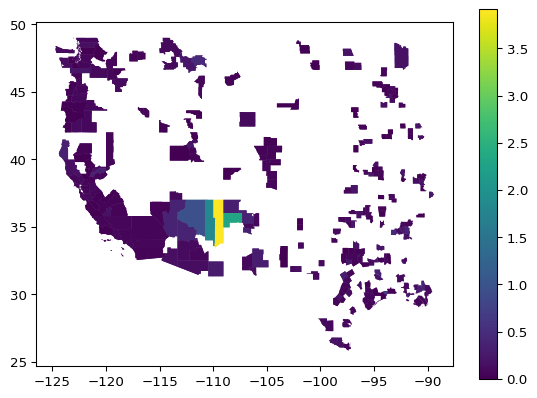
Subset to Washington, year 2022:
wa2022 = gdf.loc[(gdf.state == "Washington") & (gdf.year == "2022")]

wa2022.plot("percent_lacking_plumbing")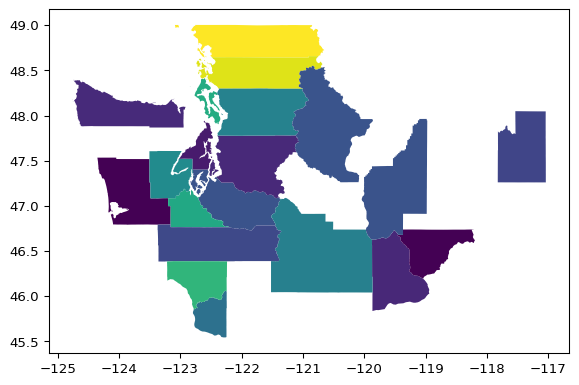
Interactive map plot:
wa2022.explore("percent_lacking_plumbing", legend=True)Make this Notebook Trusted to load map: File -> Trust Notebook
Variables used to calculate ADI
If you are interested to access the variables that computed the ADI score, you can access the dataframe and data dictionary here:
adi_2022 = pd.read_csv("https://github.com/fhdsl/datathon_winter_2025/raw/refs/heads/main/area_deprivation_index_2022.csv")
adi_2023 = pd.read_csv("https://github.com/fhdsl/datathon_winter_2025/raw/refs/heads/main/area_deprivation_index_2023.csv")
data_dictionary = pd.read_csv("https://github.com/fhdsl/datathon_winter_2025/raw/refs/heads/main/raw_data_dictionary.csv")