fulldata |>
  ggplot() +
  aes(x=adi) +
  geom_histogram()
`stat_bin()` using `bins = 30`. Pick better value with `binwidth`.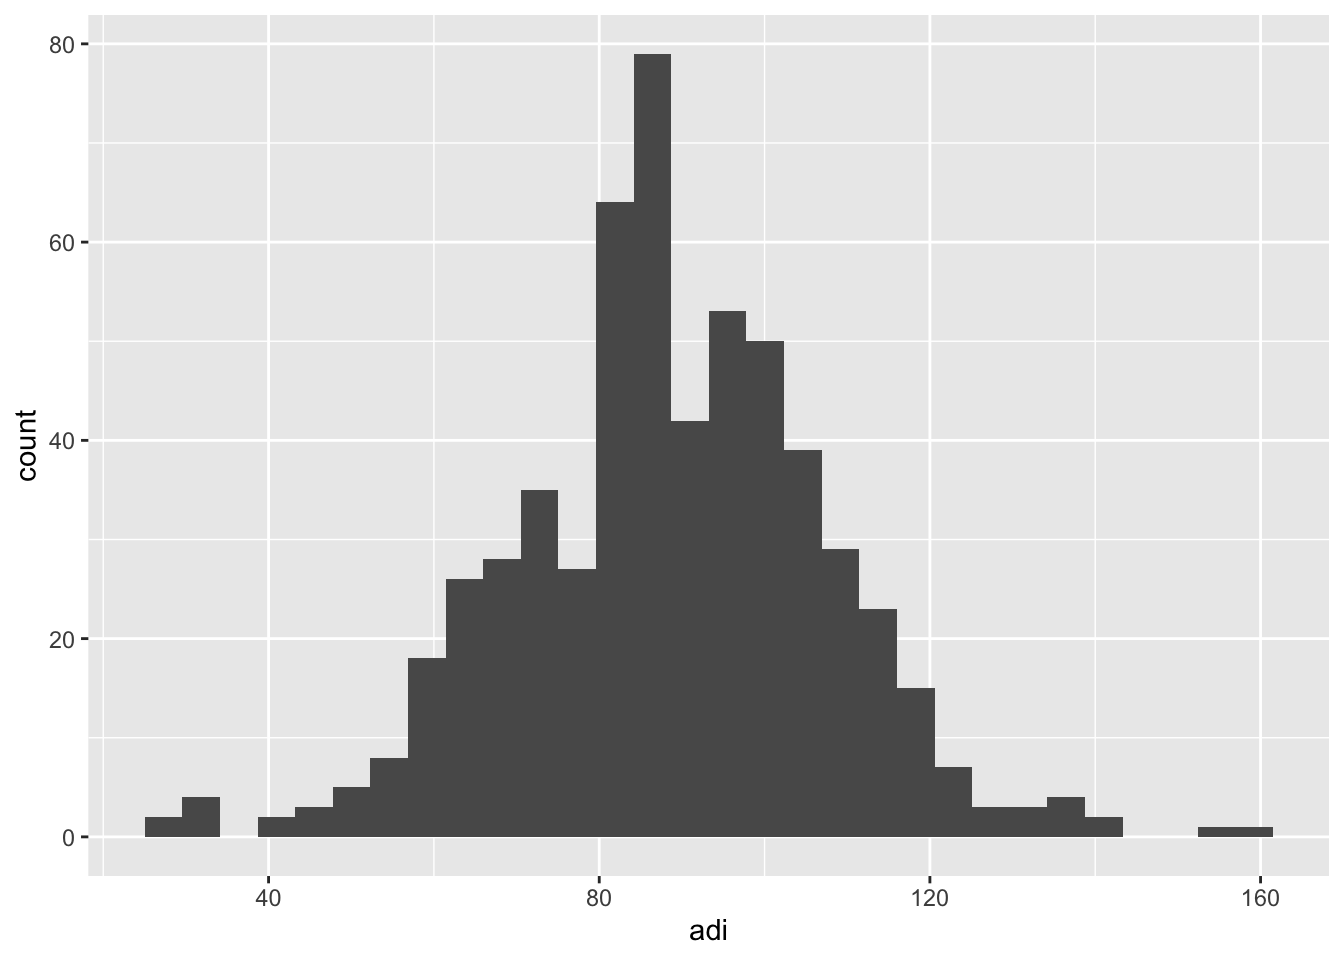
This data was first shown in Tidy Tuesday: https://github.com/rfordatascience/tidytuesday/blob/main/data/2025/2025-01-28/readme.md
More interesting reading:
The American Community Survey (ACS) helps local officials, community leaders, and businesses understand the changes taking place in their communities. It is the premier source for detailed population and housing information about our nation.
Marginalized populations are often disproportionately affected by water insecurity. Communities of color and individuals living below the poverty line are frequently the hardest hit by water-related hazards
Researchers in the USGS Social and Economic Drivers program identified factors of social vulnerability associated with conditions of water insecurity.
The team found that a small subset of social vulnerability factors was well studied and was consistently associated with water insecurity. These factors included multiple demographic characteristics:
Low income and impoverished persons are more likely to experience conditions associated with water insecurity.
“The Area Deprivation Index (ADI) is based on a measure created by the Health Resources & Services Administration (HRSA) over two decades ago for primarily county-level use, but refined, adapted, and validated to the Census block group/neighborhood level by Amy Kind, MD, PhD and her research team at the University of Wisconsin-Madison. It allows for rankings of neighborhoods by socioeconomic status disadvantage in a region of interest (e.g. at the state or national level).”https://www.neighborhoodatlas.medicine.wisc.edu
fulldata |>
ggplot() +
aes(x=adi) +
geom_histogram()`stat_bin()` using `bins = 30`. Pick better value with `binwidth`.
This is one set of fits from a paper, to understand the overall contributions of each to the ADI model:
| Census Block Group Components | Factor Score Coefficients |
|---|---|
| Percent of the block group’s population aged ≥ 25 years with < 9 years of education | 0.0849 |
| Percent aged ≥ 25 years with greater than or equal to a high school diploma | −0.0970 |
| Percent of employed persons ≥16 years of age in white-collar occupations | −0.0874 |
| Median family income | −0.0977 |
| Income disparity | 0.0936 |
| Median home value | −0.0688 |
| Median gross rent | −0.0781 |
| Median monthly mortgage | −0.0770 |
| Percent owner-occupied housing units (home ownership rate) | −0.0615 |
| Percent of civilian labor force population ≥ 16 years of age unemployed (unemployment rate) | 0.0806 |
| Percent of families below the poverty level | 0.0977 |
| Percent of population below 150% of the poverty threshold | 0.1037 |
| Percent of single-parent households with children < 18 years of age | 0.0719 |
| Percent of occupied housing units without a motor vehicle | 0.0694 |
| Percent of occupied housing units without a telephone | 0.0877 |
| Percent of occupied housing units without complete plumbing (log) | 0.0510 |
| Percent of occupied housing units with more than one person per room (crowding) | 0.0556 |
fulldata |>
  dplyr::filter(year==2022) |>
  ggplot() +
  aes(x=percent_lacking_plumbing, y=adi) +
  geom_point()
Warning: Removed 1 row containing missing values or values outside the scale range
(`geom_point()`).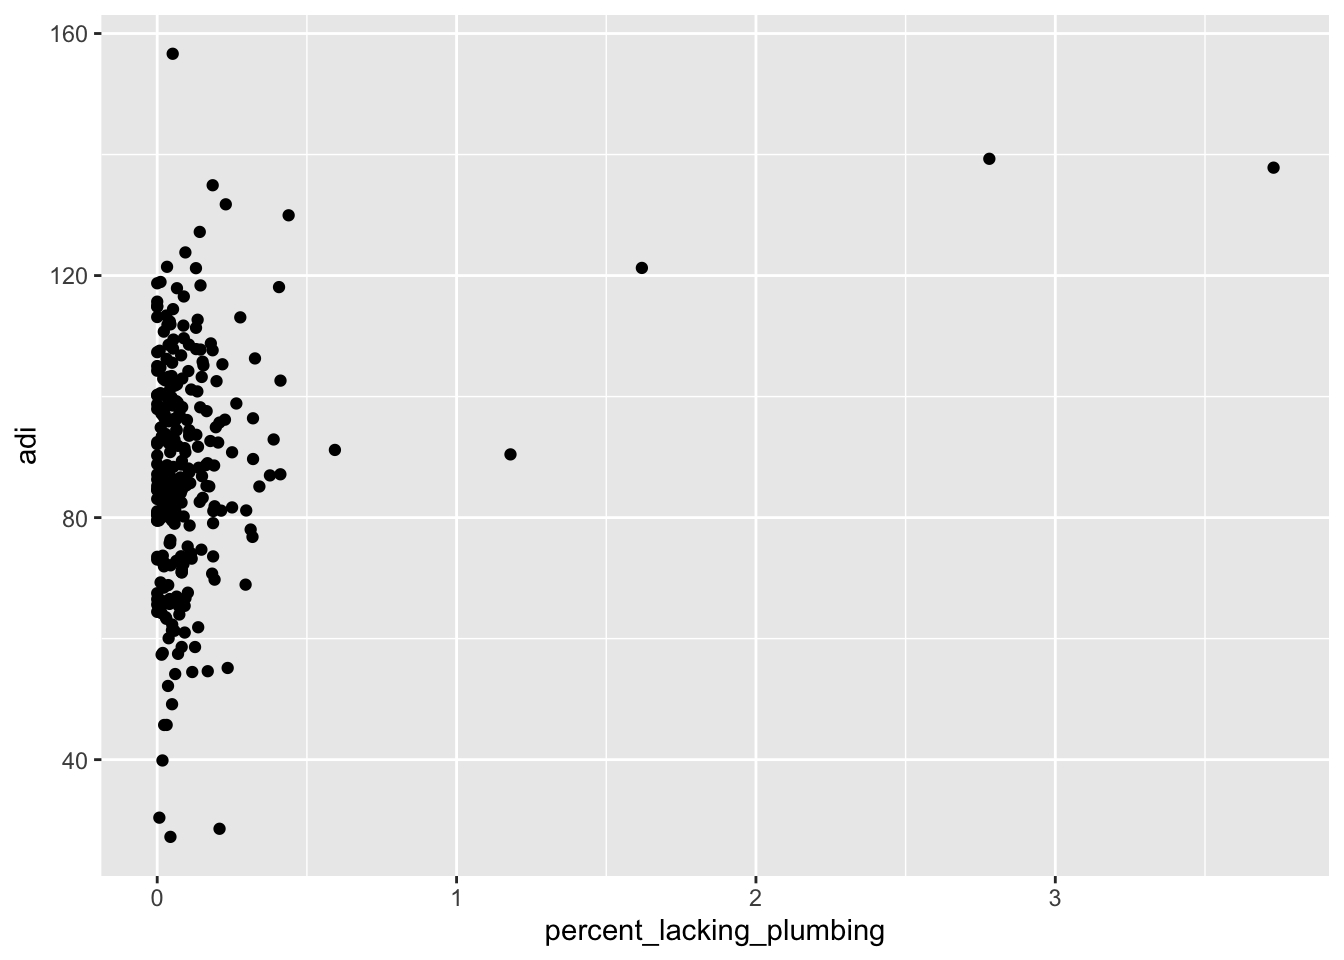
There are only a few counties that have large percentages of households lacking plumbing:
library(tidyverse)

fulldata |>
  ggplot() +
  aes(x=percent_lacking_plumbing) +
  geom_histogram(fill="blue")
`stat_bin()` using `bins = 30`. Pick better value with `binwidth`.Warning: Removed 2 rows containing non-finite outside the scale range
(`stat_bin()`).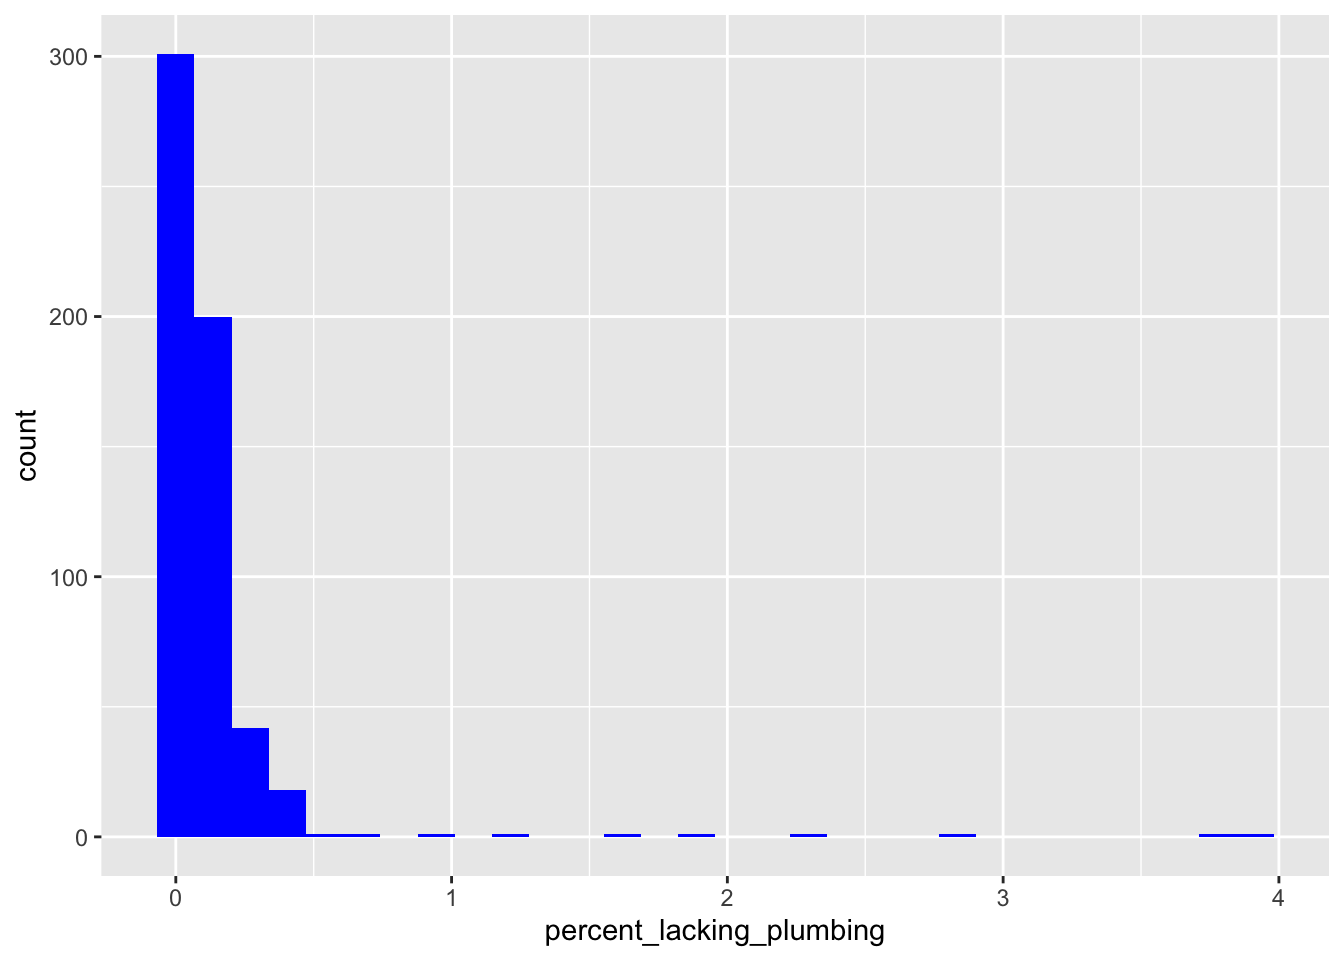
Zooming in on these counties:
fulldata |>
  ggplot() +
  aes(x=percent_lacking_plumbing) +
  geom_histogram(fill="blue") +
  xlim(1,5)
`stat_bin()` using `bins = 30`. Pick better value with `binwidth`.Warning: Removed 566 rows containing non-finite outside the scale range
(`stat_bin()`).Warning: Removed 2 rows containing missing values or values outside the scale range
(`geom_bar()`).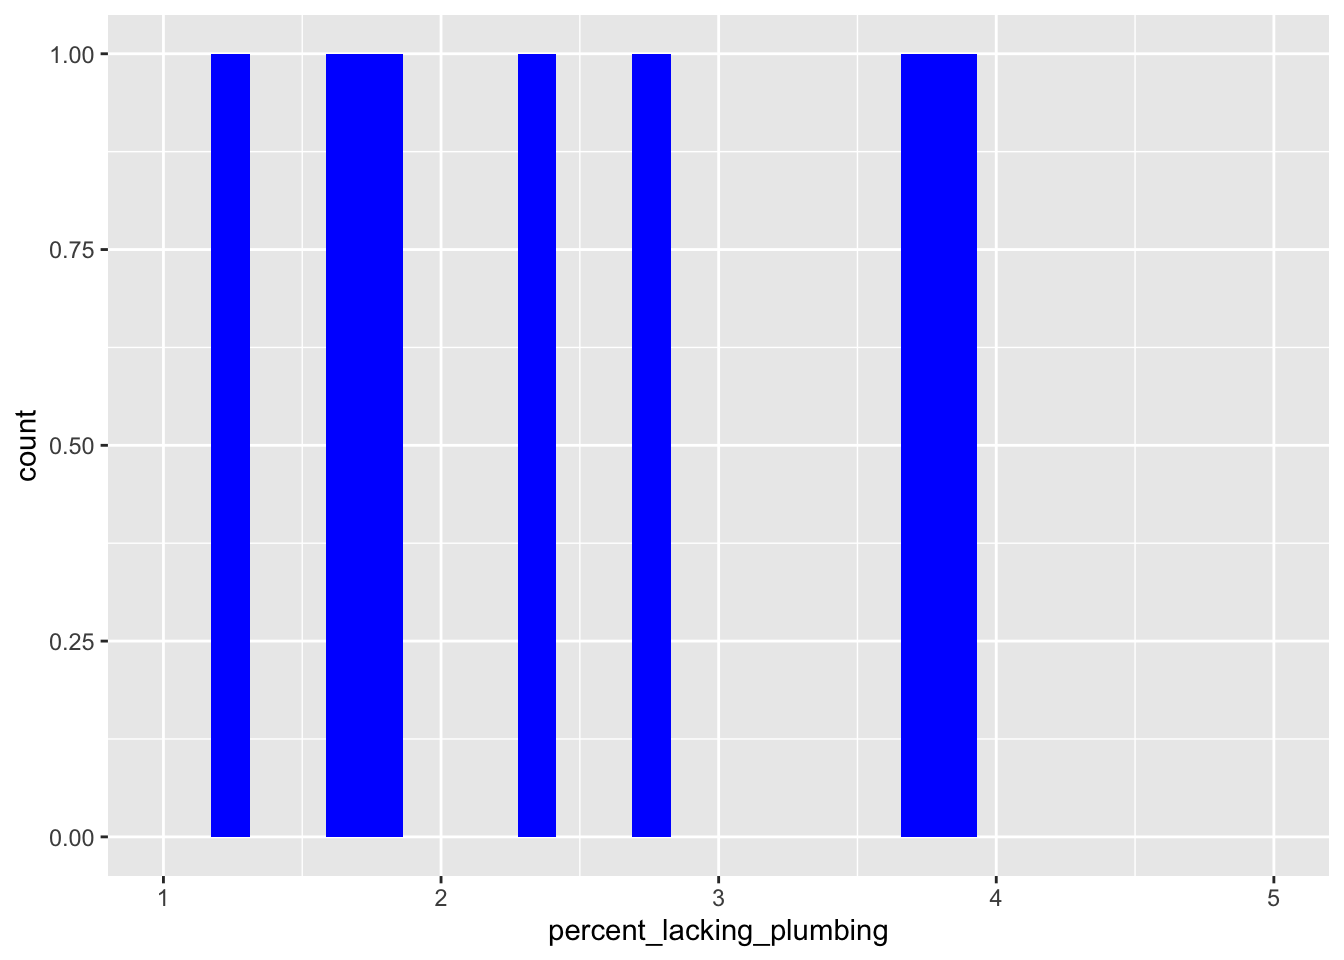
This is the list of covariates that was used to calculate the ADI:
knitr::kable(read_csv("raw_data_dictionary.csv"))Rows: 60 Columns: 3
── Column specification ────────────────────────────────────────────────────────
Delimiter: ","
chr (3): name, label, concept
ℹ Use `spec()` to retrieve the full column specification for this data.
ℹ Specify the column types or set `show_col_types = FALSE` to quiet this message.| name | label | concept |
|---|---|---|
| B11005_001 | Estimate!!Total: | Households by Presence of People Under 18 Years by Household Type |
| B11005_002 | Estimate!!Total:!!Households with one or more people under 18 years: | Households by Presence of People Under 18 Years by Household Type |
| B11005_005 | Estimate!!Total:!!Households with one or more people under 18 years:!!Family households:!!Other family: | Households by Presence of People Under 18 Years by Household Type |
| B15003_001 | Estimate!!Total: | Educational Attainment for the Population 25 Years and Over |
| B15003_002 | Estimate!!Total:!!No schooling completed | Educational Attainment for the Population 25 Years and Over |
| B15003_003 | Estimate!!Total:!!Nursery school | Educational Attainment for the Population 25 Years and Over |
| B15003_004 | Estimate!!Total:!!Kindergarten | Educational Attainment for the Population 25 Years and Over |
| B15003_005 | Estimate!!Total:!!1st grade | Educational Attainment for the Population 25 Years and Over |
| B15003_006 | Estimate!!Total:!!2nd grade | Educational Attainment for the Population 25 Years and Over |
| B15003_007 | Estimate!!Total:!!3rd grade | Educational Attainment for the Population 25 Years and Over |
| B15003_008 | Estimate!!Total:!!4th grade | Educational Attainment for the Population 25 Years and Over |
| B15003_009 | Estimate!!Total:!!5th grade | Educational Attainment for the Population 25 Years and Over |
| B15003_010 | Estimate!!Total:!!6th grade | Educational Attainment for the Population 25 Years and Over |
| B15003_011 | Estimate!!Total:!!7th grade | Educational Attainment for the Population 25 Years and Over |
| B15003_012 | Estimate!!Total:!!8th grade | Educational Attainment for the Population 25 Years and Over |
| B15003_017 | Estimate!!Total:!!Regular high school diploma | Educational Attainment for the Population 25 Years and Over |
| B15003_018 | Estimate!!Total:!!GED or alternative credential | Educational Attainment for the Population 25 Years and Over |
| B15003_019 | Estimate!!Total:!!Some college, less than 1 year | Educational Attainment for the Population 25 Years and Over |
| B15003_020 | Estimate!!Total:!!Some college, 1 or more years, no degree | Educational Attainment for the Population 25 Years and Over |
| B15003_021 | Estimate!!Total:!!Associate’s degree | Educational Attainment for the Population 25 Years and Over |
| B15003_022 | Estimate!!Total:!!Bachelor’s degree | Educational Attainment for the Population 25 Years and Over |
| B15003_023 | Estimate!!Total:!!Master’s degree | Educational Attainment for the Population 25 Years and Over |
| B15003_024 | Estimate!!Total:!!Professional school degree | Educational Attainment for the Population 25 Years and Over |
| B15003_025 | Estimate!!Total:!!Doctorate degree | Educational Attainment for the Population 25 Years and Over |
| B17010_001 | Estimate!!Total: | Poverty Status in the Past 12 Months of Families by Family Type by Presence of Related Children Under 18 Years by Age of Related Children |
| B17010_002 | Estimate!!Total:!!Income in the past 12 months below poverty level: | Poverty Status in the Past 12 Months of Families by Family Type by Presence of Related Children Under 18 Years by Age of Related Children |
| B19001_002 | Estimate!!Total:!!Less than $10,000 | Household Income in the Past 12 Months (in 2023 Inflation-Adjusted Dollars) |
| B19001_011 | Estimate!!Total:!!$50,000 to $59,999 | Household Income in the Past 12 Months (in 2023 Inflation-Adjusted Dollars) |
| B19001_012 | Estimate!!Total:!!$60,000 to $74,999 | Household Income in the Past 12 Months (in 2023 Inflation-Adjusted Dollars) |
| B19001_013 | Estimate!!Total:!!$75,000 to $99,999 | Household Income in the Past 12 Months (in 2023 Inflation-Adjusted Dollars) |
| B19001_014 | Estimate!!Total:!!$100,000 to $124,999 | Household Income in the Past 12 Months (in 2023 Inflation-Adjusted Dollars) |
| B19001_015 | Estimate!!Total:!!$125,000 to $149,999 | Household Income in the Past 12 Months (in 2023 Inflation-Adjusted Dollars) |
| B19001_016 | Estimate!!Total:!!$150,000 to $199,999 | Household Income in the Past 12 Months (in 2023 Inflation-Adjusted Dollars) |
| B19001_017 | Estimate!!Total:!!$200,000 or more | Household Income in the Past 12 Months (in 2023 Inflation-Adjusted Dollars) |
| B19113_001 | Estimate!!Median family income in the past 12 months (in 2023 inflation-adjusted dollars) | Median Family Income in the Past 12 Months (in 2023 Inflation-Adjusted Dollars) |
| B23025_003 | Estimate!!Total:!!In labor force:!!Civilian labor force: | Employment Status for the Population 16 Years and Over |
| B23025_005 | Estimate!!Total:!!In labor force:!!Civilian labor force:!!Unemployed | Employment Status for the Population 16 Years and Over |
| B25003_001 | Estimate!!Total: | Tenure |
| B25003_002 | Estimate!!Total:!!Owner occupied | Tenure |
| B25014_001 | Estimate!!Total: | Tenure by Occupants per Room |
| B25014_005 | Estimate!!Total:!!Owner occupied:!!1.01 to 1.50 occupants per room | Tenure by Occupants per Room |
| B25014_006 | Estimate!!Total:!!Owner occupied:!!1.51 to 2.00 occupants per room | Tenure by Occupants per Room |
| B25014_007 | Estimate!!Total:!!Owner occupied:!!2.01 or more occupants per room | Tenure by Occupants per Room |
| B25014_011 | Estimate!!Total:!!Renter occupied:!!1.01 to 1.50 occupants per room | Tenure by Occupants per Room |
| B25014_012 | Estimate!!Total:!!Renter occupied:!!1.51 to 2.00 occupants per room | Tenure by Occupants per Room |
| B25014_013 | Estimate!!Total:!!Renter occupied:!!2.01 or more occupants per room | Tenure by Occupants per Room |
| B25044_001 | Estimate!!Total: | Tenure by Vehicles Available |
| B25044_003 | Estimate!!Total:!!Owner occupied:!!No vehicle available | Tenure by Vehicles Available |
| B25044_010 | Estimate!!Total:!!Renter occupied:!!No vehicle available | Tenure by Vehicles Available |
| B25064_001 | Estimate!!Median gross rent | Median Gross Rent (Dollars) |
| B25077_001 | Estimate!!Median value (dollars) | Median Value (Dollars) |
| B25088_002 | Estimate!!Median selected monthly owner costs (dollars) –!!Housing units with a mortgage (dollars) | Median Selected Monthly Owner Costs (Dollars) by Mortgage Status |
| C17002_001 | Estimate!!Total: | Ratio of Income to Poverty Level in the Past 12 Months |
| C17002_002 | Estimate!!Total:!!Under .50 | Ratio of Income to Poverty Level in the Past 12 Months |
| C17002_003 | Estimate!!Total:!!.50 to .99 | Ratio of Income to Poverty Level in the Past 12 Months |
| C17002_004 | Estimate!!Total:!!1.00 to 1.24 | Ratio of Income to Poverty Level in the Past 12 Months |
| C17002_005 | Estimate!!Total:!!1.25 to 1.49 | Ratio of Income to Poverty Level in the Past 12 Months |
| C24010_001 | Estimate!!Total: | Sex by Occupation for the Civilian Employed Population 16 Years and Over |
| C24010_003 | Estimate!!Total:!!Male:!!Management, business, science, and arts occupations: | Sex by Occupation for the Civilian Employed Population 16 Years and Over |
| C24010_039 | Estimate!!Total:!!Female:!!Management, business, science, and arts occupations: | Sex by Occupation for the Civilian Employed Population 16 Years and Over |